Digital Asset Concentration Risk Framework: 2026 Guide

A digital asset concentration risk framework is a structured methodology that finance professionals use to quantify and control risks arising from overexposure to specific custodians, protocols, or token holders in crypto portfolios. The standard industry term is “concentration risk management,” and it applies directly to digital assets through three structural vectors: custody consolidation, protocol dependency, and holder distribution. Marsh’s 2026 risk outlook explicitly flags all three as systemic vulnerabilities requiring scenario analysis and dedicated risk frameworks. This guide gives you the measurement tools, regulatory benchmarks, and stress testing methods to build a program that holds up under real market conditions.
What is a digital asset concentration risk framework?
Concentration risk in digital assets is structural. It is created by overexposure to a limited set of custody providers, protocols, or wallet holders, and it generates systemic failure points that can cascade across an entire portfolio. Unlike traditional asset classes, digital assets introduce concentration risks at multiple infrastructure layers simultaneously, making a single-lens view dangerously incomplete.
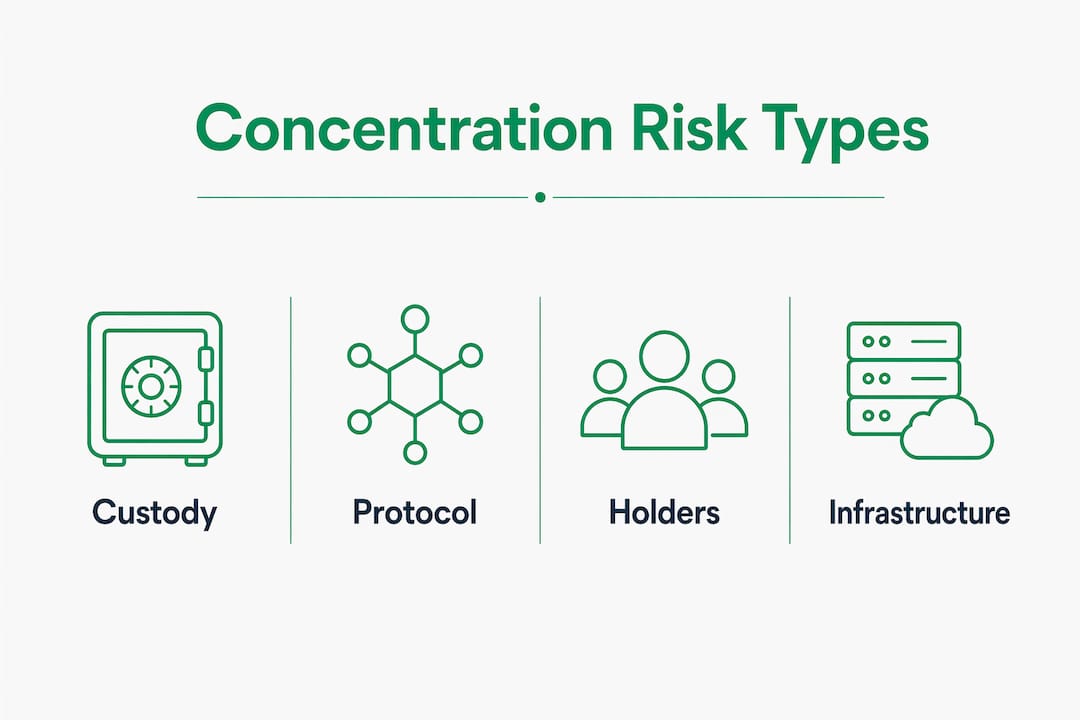
The framework addresses three primary concentration vectors:
- Custody concentration: Over-reliance on one or two custodians creates single points of operational and counterparty failure. If a custodian is hacked, insolvent, or operationally disrupted, the entire position is at risk.
- Protocol and smart contract concentration: Holding assets primarily within one DeFi protocol or blockchain exposes the portfolio to that protocol’s specific vulnerabilities, governance failures, and liquidity constraints.
- Holder distribution concentration: When a small number of wallets control a large share of a token’s circulating supply, price stability and liquidity become hostage to the decisions of those holders.
A complete framework integrates measurement, limit-setting, and mitigation controls across all three vectors. It does not treat them in isolation. The 2026 Aave rsETH incident, where misaligned operational and concentration limits triggered cascade failures, illustrates precisely what happens when DeFi lending protocols set asset-level caps without accounting for protocol reserve coverage.
Pro Tip: Apply a “look-through” approach that traces exposure through exchanges, bridges, and collateral use. Portfolio-level concentration numbers routinely understate actual systemic exposure.
What are the main types of concentration risks in digital asset portfolios?
Custody concentration is the most regulated dimension of digital asset risk. Regulators in Canada, through CIRO’s four-tier custody framework, cap client crypto holdings at 100% with Tier 1 and 2 custodians, 75% with Tier 3, and 40% with Tier 4 or internal arrangements. These caps exist because custody risk scales nonlinearly with concentration. A custodian holding 80% of your assets is not twice as risky as one holding 40%. It is categorically more dangerous.
Protocol concentration risk is subtler and often underestimated. A portfolio that holds assets across five tokens but deploys all of them through a single DeFi lending protocol has not diversified its protocol risk at all. The 2026 Aave rsETH supply cap incident demonstrated how a single protocol’s operational limits can freeze capital and trigger forced liquidations across multiple positions simultaneously.
Holder distribution concentration affects price stability and exit liquidity. When the top 10 wallets of a token control more than 50% of circulating supply, any coordinated or uncoordinated sell decision by those holders creates slippage that smaller market participants cannot absorb. This is not a theoretical risk. It is a structural feature of most mid-cap and small-cap crypto assets.
Systemic infrastructure concentration adds a fourth layer that most frameworks miss. If multiple custodians, protocols, and exchanges all rely on the same cloud infrastructure provider or oracle network, a failure in that shared dependency propagates across positions that appear diversified on paper. Monitoring this requires a look-through concentration approach that maps infrastructure dependencies, not just nominal asset allocations.
How to measure concentration risk effectively using quantitative tools?
The Herfindahl-Hirschman Index, scaled from 0 to 10,000, is the standard quantitative tool for measuring concentration in both portfolio weights and token holder distributions. An HHI of 0 represents perfect diversification. An HHI of 10,000 represents a single-entity monopoly. For digital asset portfolios, HHI computed over holder wallet shares provides a single comparable number that tracks structural risk over time.

Research confirms the stakes are real. A 1% increase in HHI corresponds to a roughly 2.31% increase in tail risk as measured by 1% value-at-risk, and this relationship nearly doubles during high-volatility regimes. That nonlinear amplification means concentration risk is not a linear dial you can turn down gradually. It accelerates.
The table below summarizes the core measurement tools and their application:
| Metric | What it measures | Best used for |
|---|---|---|
| Herfindahl-Hirschman Index (HHI) | Portfolio or holder distribution concentration | Baseline scoring and trend monitoring |
| Active-tradable concentration ratio | Concentration among liquid, non-locked wallets | Price stability and exit liquidity risk |
| Wallet classification analysis | Holder type breakdown (exchange, DAO, vesting, bridge) | Behavioral risk and sell-pressure modeling |
| Liquidity depth comparison | Order book depth versus concentrated holdings | Slippage and market impact estimation |
| Scenario-based VaR | Tail risk under concentrated failure scenarios | Stress testing and limit calibration |
Raw top-N holder ratios are insufficient on their own. A token where the top 10 wallets hold 60% of supply looks dangerous until you classify those wallets and discover that 40% of that supply sits in locked vesting contracts and DAO treasuries with multi-signature governance. The active-tradable concentration metric filters out locked, treasury, and bridge wallets to reveal the share of supply that can actually move markets.
Pro Tip: Run HHI calculations on both your portfolio weights and on the holder distributions of each underlying token. A portfolio with low asset-level HHI can still carry extreme systemic risk if each asset has a highly concentrated holder base.
What frameworks and regulatory guidelines inform custody concentration limits?
CIRO’s Digital Asset Custody Framework, launched in Canada, provides the most detailed regulatory tiering system currently available for institutional digital asset custody. The four tiers reflect a combination of regulatory oversight, insurance coverage, and operational controls. Tier 1 and 2 custodians meet the highest standards and receive the most permissive concentration limits. Tier 4 and internal arrangements carry the tightest caps because they carry the highest unmitigated risk.
The table below maps CIRO’s custody tiers to their concentration limits and the key risk rationale:
| Custody tier | Maximum allocation | Primary risk driver |
|---|---|---|
| Tier 1 and 2 (regulated, insured) | 100% | Lowest counterparty and operational risk |
| Tier 3 (qualified, partial oversight) | 75% | Moderate regulatory and insurance gaps |
| Tier 4 and internal (limited oversight) | 40% | Highest operational and counterparty exposure |
One unintended consequence of tiered frameworks deserves attention. Regulation may crowd flows into fewer large custodians as institutions seek Tier 1 and 2 status, which paradoxically increases systemic concentration at the market level even as individual firm limits are respected. A firm that complies with CIRO’s caps while placing 100% of assets with a single Tier 1 custodian has met the letter of the regulation but not its spirit.
Governance controls that complement custody tiering include quarterly assurance reports from custodians, insurance coverage verification, and independent audit thresholds. For stablecoins held in custody, monthly institutional-grade attestations with full reserve coverage reduce run-risk by improving transparency. Proof of reserves alone is insufficient without governance rigor around attestation scope and methodology. For a board-level view of how custody concentration fits into broader governance obligations, the board oversight checklist from Wush provides a structured starting point.
How to integrate whale concentration analysis into digital asset risk management?
Whale concentration analysis starts with a definition. A whale wallet is any address that holds a share of circulating supply large enough to move the market if it transacts. The threshold varies by token liquidity, but a useful working rule is any wallet holding more than 1% of active-tradable supply in a token with less than $500 million in daily trading volume.
The five-step methodology from Deep Blue Alpha for whale concentration risk assessment provides a replicable process:
- Pull the full holder distribution from a block explorer such as Etherscan or Solscan.
- Classify each wallet type: exchange hot wallet, exchange cold wallet, DAO treasury, vesting contract, bridge contract, or individual holder.
- Remove locked and non-tradable wallets to compute active-tradable supply.
- Recalculate HHI and top-N concentration ratios using only active-tradable wallets.
- Compare the resulting concentration figures against on-chain liquidity depth to estimate slippage risk at various sell sizes.
Transaction history adds behavioral context that static snapshots miss. A whale wallet that has not transacted in 18 months carries different risk than one that moved assets last week. Monitoring wallet activity through platforms like Nansen or Arkham Intelligence allows risk managers to detect behavioral shifts before they become price events.
The connection to liquidity depth assessment is direct. A token where the top five active wallets hold 40% of tradable supply but where daily order book depth can absorb a 10% supply sale with less than 2% slippage is materially safer than one where the same concentration faces a thin order book. Concentration metrics without liquidity context produce false alarms and missed risks in equal measure.
What are best practices for scenario analysis in concentration risk frameworks?
Scenario analysis is the mechanism that converts concentration metrics into governance decisions. The process starts with mapping failure points across all four concentration layers: custody, protocol, infrastructure, and wallet distribution. Each failure point becomes the seed of a scenario.
A structured scenario design process follows these steps:
- Identify the failure node. Name the specific custodian, protocol, infrastructure provider, or whale wallet that anchors the scenario.
- Define the trigger event. Use historical incidents as templates: exchange insolvency (FTX 2022), protocol exploit (Euler Finance 2023), or infrastructure outage (AWS us-east-1 disruption).
- Map the cascade path. Trace how the failure propagates through custody, collateral, liquidity, and counterparty exposure.
- Quantify the impact. Apply VaR and expected shortfall calculations to the concentrated positions affected.
- Test the governance response. Determine whether existing limits, insurance, and operational controls would contain the damage or whether they would be overwhelmed.
Marsh’s 2026 risk outlook recommends improved data collection and scenario tools specifically to understand systemic failure points and target mitigations. The recommendation reflects a gap that most institutional programs still have: they measure concentration but do not systematically stress test it.
DeFi contexts require additional scenario design discipline. DeFi risk models often underestimate operational and tail risks linked to concentration, which means coupling limits with protocol risk design rather than relying solely on correlation data. The Aave rsETH incident is the clearest 2026 example of what happens when scenario analysis is absent from limit calibration.
Pro Tip: Run at least one scenario per quarter that assumes your largest single custodian becomes unavailable for 72 hours. Map the operational, liquidity, and regulatory consequences before the scenario is real.
Key takeaways
A digital asset concentration risk framework requires measurement, regulatory alignment, and scenario testing across custody, protocol, and holder distribution layers to be effective.
| Point | Details |
|---|---|
| Three concentration vectors | Custody, protocol, and holder distribution each require separate measurement and limits. |
| HHI as the baseline metric | Compute HHI over active-tradable wallet shares, not raw holder counts, for accurate risk scoring. |
| CIRO custody tiering | Apply tiered caps of 100%, 75%, and 40% based on custodian tier to control custody concentration. |
| Whale analysis requires classification | Filter locked and treasury wallets before calculating active-tradable concentration ratios. |
| Scenario analysis closes the loop | Map cascade failure paths quarterly to convert concentration metrics into governance decisions. |
Why most concentration frameworks stop too early
Most institutional risk programs I have reviewed treat concentration risk as a portfolio allocation problem. They set asset-level limits, check custody percentages against a threshold, and call it done. That approach misses the structural reality of digital assets entirely.
The infrastructure layer is where the real systemic risk lives in 2026. Two custodians that appear independent on paper may both rely on the same cloud provider, the same oracle network, or the same stablecoin for settlement. A failure in that shared dependency does not care about your custody diversification policy. It hits everything simultaneously.
The whale concentration problem is equally underappreciated. I have seen risk teams spend significant effort computing top-10 holder ratios and then make no adjustment for the fact that six of those wallets are locked vesting contracts. The active-tradable concentration number is the one that matters for price stability, and it is almost never the one being reported.
The most important shift in thinking is this: concentration risk in digital assets is not a static number to be checked periodically. It is a dynamic structural condition that changes with every large wallet transaction, every protocol upgrade, and every regulatory change that redirects custody flows. The frameworks that work are the ones built for continuous monitoring, not quarterly snapshots. For teams building out market risk monitoring programs, concentration analysis belongs inside that process, not alongside it.
— Gregg
How DARE supports your concentration risk program
Building a concentration risk framework from scratch is a governance challenge as much as a technical one. Wush’s Digital Asset Readiness Evaluation, known as DARE, provides the structured assessment and certification framework that risk management teams need to evaluate their current controls against regulatory standards including CIRO’s custody tiering and Marsh’s scenario analysis recommendations. DARE covers custody governance, protocol risk controls, operational safeguards, and compliance alignment through modular assessments with annual renewal to keep pace with evolving standards. Teams that complete the DARE certification gain an independent, blockchain-verified credential that demonstrates institutional-grade readiness to regulators, boards, and counterparties. Explore the full readiness evaluation to see where your concentration risk controls stand today.
FAQ
What is a digital asset concentration risk framework?
A digital asset concentration risk framework is a structured methodology for identifying, measuring, and controlling overexposure to specific custodians, protocols, or token holders in a digital asset portfolio. It integrates quantitative metrics like HHI, regulatory custody limits, and scenario analysis into a single governance program.
How does the Herfindahl-Hirschman Index apply to crypto assets?
HHI scaled from 0 to 10,000 measures concentration in portfolio weights or token holder distributions, with a 1% increase in HHI corresponding to a roughly 2.31% increase in tail risk. Applying it to active-tradable wallet shares, rather than raw holder counts, produces the most accurate risk signal.
What custody concentration limits does CIRO require?
CIRO’s Digital Asset Custody Framework caps holdings at 100% with Tier 1 and 2 custodians, 75% with Tier 3, and 40% with Tier 4 or internal custody arrangements. These limits reflect the operational and counterparty risk profile of each custody tier.
Why is whale concentration analysis more than a top-10 holder ratio?
Raw top-10 holder ratios include locked vesting contracts, DAO treasuries, and bridge wallets that cannot trade freely. Filtering for active-tradable supply reveals the true concentration of sell pressure and must be compared against on-chain liquidity depth to assess real price-stability risk.
How often should scenario analysis be run for concentration risk?
Quarterly scenario analysis is the minimum standard recommended by Marsh’s 2026 risk outlook, with at least one scenario per cycle targeting the largest single custodian or protocol dependency. High-volatility periods warrant more frequent reviews given the nonlinear amplification of concentration risk under stress.